English | MP4 | AVC 1280×720 | AAC 44KHz 2ch | 2h 43m | 479 MB
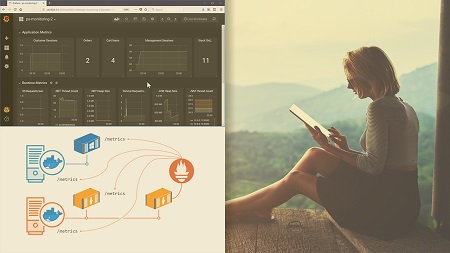
You can add consistent monitoring to your whole application with Docker, the same for every container in every environment. This course teaches you how to expose metrics from Linux and Windows containers, collect them, and display them in dashboards.
It’s easy to run new and old applications in Docker, but you can’t put containerized apps into production without monitoring. In this course, Monitoring Containerized Application Health with Docker, you’ll learn how to implement effective monitoring for Linux and Windows containers. First, you’ll learn how to gather and visualize metrics from containers using Prometheus and Grafana. Next, you’ll see how to add metrics to your application, and export metrics from the Java and .NET runtimes and from the Docker platform. Finally, you’ll explore how to build an effective dashboard with a single view over the health of your whole application. When you’re finished with this course, you’ll be ready to add monitoring to your application and move confidently to production.
Table of Contents
Course Overview
1 Course Overview
Architecting Monitoring for Containerized Applications
2 Course Intro and Module Overviews
3 Understanding Monitoring for Containerized Apps
4 Demo – Monitoring Containerized Applications
5 Introducing Prometheus and Grafana
6 Demo – Monitoring with Prometheus
7 Consistent Monitoring with Containers
8 Demo – Docker Platform Metrics
9 Module Summary
Collecting Metrics with Prometheus
10 Module Overview
11 Using a Container to Run Prometheus
12 Demo – Running Prometheus in Docker
13 Configuration and Service Discovery in Prometheus
14 Demo – Configuring Prometheus
15 Demo – Service Discovery in Prometheus
16 Understanding Prometheus Data Types
17 Demo – Counters and Gauges in Prometheus
18 Module Summary
Exposing Runtime Metrics to Prometheus
19 Module Overview
20 Using a Utility to Export Runtime Metrics
21 Demo – Exporting Java Runtime Metrics
22 Monitoring Java Web Apps in Linux Containers
23 Demo – Exporting .NET Runtime Metrics
24 Monitoring ASP.NET Apps in Windows Containers
25 Demo – Dynamically Scraping Runtime Metrics with Prometheus
26 Module Summary
Exposing Application Metrics to Prometheus
27 Module Overview
28 Recording Metrics in Your Application
29 Demo – Adding Application Metrics to Java Apps
30 Demo – Adding Application Metrics to .NET Apps
31 Prometheus Client Libraries
32 Demo – Scraping Application Metrics with Prometheus
33 Instrumentation Best Practices
34 Module Summary
Exposing Docker Metrics to Prometheus
35 Module Overview
36 Working with Docker Platform Metrics
37 Demo – Enabling and Using Metrics in Docker Desktop
38 Understanding Docker Engine Metrics
39 Demo – Enabling and Using Metrics in Docker Swarm
40 Understanding Docker Swarm Mode Metrics
41 Demo – Scraping Docker Metrics in Prometheus
42 Module Summary
Building Dashboards with Grafana
43 Module Overview
44 Approaches to Running Grafana in Containerized Applications
45 Demo – Running Grafana in Docker on Linux and Windows
46 Working with Data Sources and Dashboards in Grafana
47 Demo – Building Your Application Dashboard in Grafana
48 Demo – Packaging a Custom Grafana Image with Your Dashboard
49 Module Summary
50 Course summary
Resolve the captcha to access the links!