English | MP4 | AVC 1280×720 | AAC 44KHz 2ch | 2h 12m | 400 MB
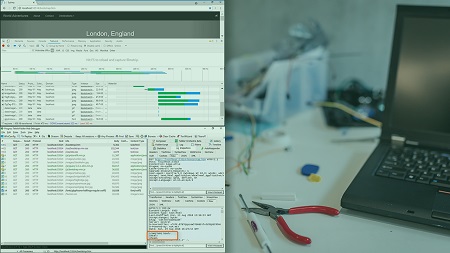
Do your websites always work perfectly? Mine don’t either, which is why this course will help you debug problems using Fiddler and Chrome DevTools — you’ll learn about issues with JavaScript, CSS, performance, and HTTPS.
Websites don’t always work as expected. In this course, Debugging Your Website with Fiddler and Chrome DevTools, you will learn foundational knowledge necessary to debug website problems. First, you will learn diagnostic techniques. Next, you will discover how to modify requests and responses. Finally, you will explore how to decrypt HTTPS. When you’re finished with this course, you will have the skills and knowledge of Fiddler and Chrome DevTools needed to debug your website issues.
Table of Contents
Course Overview
1 Course Overview
Introduction to Fiddler
2 Introduction
3 HTTP
4 What Is Fiddler
5 How Does Fiddler Work
6 Chrome DevTools
7 It Works on My Machine
8 Summary
Diagnosing and Resolving JavaScript Issues
9 Introduction
10 Techniques
11 Console Object
12 Summary
Diagnosing and Resolving CSS Issues
13 Introduction
14 Techniques
15 CSS Coverage
16 Summary
Diagnosing and Resolving Performance Issues
17 Performance Rules
18 Performance Review
19 Performance Techniques
20 HTTP 2
21 Chrome DevTools Audits
22 Summary
Determining Website Behavior and Potential Issues
23 Introduction
24 Request Modification
25 Blocked Requests
26 Slow Responses
27 First Request Return Visits
28 Sensors
29 Summary
Solving Real World Problems
30 Introduction
31 Who Requested That
32 Who Modified That
33 Other Platforms and Devices
34 Someone Else s Computer
35 HTTPS
36 Device Rendering
37 Summary
Resolve the captcha to access the links!