English | MP4 | AVC 1280×720 | AAC 44KHz 2ch | 12 Hours | 4.89 GB
Learn and complete all of the steps to deploy your very own data analytics dashboard on the web with Python
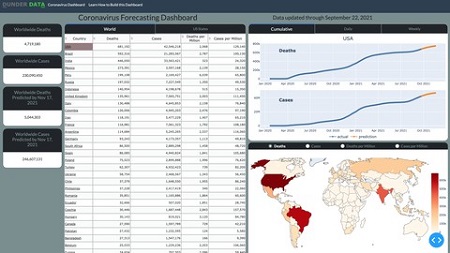
This course teaches you all of the skills to build interactive data analytics dashboards with Python. Specifically, you will be building a Coronavirus Forecasting Dashboard that shows historical and predicted values for deaths and cases for all countries in the world and US states from the ongoing coronavirus pandemic. The final product will be a live dashboard, automatically updated daily, hosted on a remote server for anyone, anywhere in the world to see!
You will learn and complete the entire process for building the dashboard including the following topics:
Getting, Cleaning, and Transforming the Data – You will learn how to collect the data, find and clean bad data, and transform it so that it can be used for building models capable of prediction.
Data Smoothing – You will learn several different techniques such as LOWESS to smooth the jagged raw data so that the model can better detect trends.
Exponential Growth and Decline Models – You will begin modeling coronavirus cases for each area of the world with these simple models that can capture a single exponential growth or decline phase, but not both.
Logistic Growth Models – You will learn about a separate class of “S-Curve” models capable of capturing both exponential growth and decline in the same model.
Modeling New Waves – Coronavirus cases appear in waves over different time periods. You will learn how to change your model so that it can detect any number of new waves in the future.
Encapsulation into Classes – After selecting your model, you will encapsulate all of the code together into Python classes, eventually to be used in your final production code.
Visualizations with Plotly – You will learn how to use the Plotly Python library to create interactive data visualizations targeted for the web
HTML and CSS – You are building a web application and will learn the fundamentals of HTML and CSS to help add customization with the help of Dash.
Building the Dashboard with Dash – You will learn how to build all of the components and interactivity of the dashboard with the Dash Python library.
Deployment – One of the most exciting parts of a project is deploying it on your own server for the world to see. You will learn two different deployment options – one simple and the other more complex, but with more flexibility.
What you’ll learn
- Build an interactive data analytics dashboard using the Dash library in Python
- Model coronavirus cases and deaths using generalized logistic functions
- Smooth data using locally weighted scatterplot smoothing
- Read and clean data so that it is suitable for modeling
- Learn how to use Plotly, an interactive data visualization library in Python targeting the web
- Learn HTML and CSS fundamentals to add and style elements of the dashboard
- Setup an Ubuntu server running NGINX to host the dashboard on the web for all to see
- Run nightly cron jobs to update the data and model predictions
- Encapsulate all of your code into Python classes to ease automation
- Learn how to complete a comprehensive, end-to-end project in Python using a vast array of skills
Table of Contents
Getting Started
1 Course Overview
2 Downloading the Course Material
3 Exploring the Course Material
4 Creating the Virtual Environment
5 Creating the Virtual Environment (fast)
6 Activating and Deactivating the Virtual Environment
7 Launching and Exploring the Dashboard
8 Opening the Jupyter Notebooks
9 A Guide To Completing the Course
Getting the Data
10 Downloading the Data
11 Downloading all of the Data
12 Saving the Data Locally
Data Cleaning and Transformation
13 Selecting the Correct Columns
14 Updating the Run Function
15 Updating Area Names
16 Aggregate Repeating Areas
17 Transposing the Data to Time Series
18 Finding and Handling Bad Data
19 Encapsulate all Steps into a Class
Data Smoothing
20 Moving Average Smoothing
21 LOWESS Smoothing
22 Build a Function to Smooth the Data
Exponential Growth and Decline Models
23 Exponential Growth and Decline
24 Finding Optimal Parameters to Model Total Cases with scipy’s least squares
25 Predicting Unseen Data
26 Automate Model Training
27 Automate Daily Predictions
28 Automate Cumulative Predictions
29 Plotting Actual vs Prediction
30 Automating Smoothing, Training, Predicting, and Plotting
31 Continuous Exponential Growth Models
32 Modeling Exponential Decline
Logistic Growth Models
33 Assymptotes
34 S-Curves
35 Experimenting with Logistic Function Parameters
36 Estimating Logistic Function Parameters
37 Generalized Logistic Function
Modeling New Waves
38 Limit the Data
39 Vertically Shifting the Generalized Logistic Function
40 Upper Bounds of L
41 Automating Parameter Bounds
42 Finding New Waves
43 The Final Model
Encapsulation into Classes
44 The CasesModel Class
45 Instantiating and Running CasesModel
46 Predict Deaths using Case Fatality Ratio
47 The DeathsModel Class
48 Instantiating and Running DeathsModel
49 Creating Final Tables for the Dashboard
50 Create Summary Table of Current Date
51 Code within the Modules
Running all of the Code
52 Explaining update.py
53 Executing update.py
Visualization with Plotly
54 Intro to Plotly
55 Discovering Trace Properties
56 Updating the Layout
57 Creating a Figure with Multiple Traces
58 Automate Plotting of an Area
59 Creating Subplots
60 Adding Annotations
61 Choropleth Maps
62 Plotly Summary
Intro to HTML and CSS
63 HTML Elements
64 Writing HTML in the Notebook
65 The Anchor Element
66 The Image Element
67 Unordered and Ordered Lists and List Items
68 The Table Element
69 Logical Division of Content Element
70 HTML Syntax
71 Block vs Inline Elements
72 Styling with CSS
73 CSS Distance Units
74 Element Margins
75 Changing Display from Block to Inline
76 Selecting Elements by class and id
77 Container-Item Terminology
78 The Flexbox Layout
79 The Grid Layout
Building the Dashboard with Dash
80 Parts of a Dash Application
81 A Minimal Dashboard
82 HTML Elements in Dash
83 Adding CSS
84 Creating a Data Table
85 Creating Tabs
86 Recreating all Plotly Figures
87 Adding Plotly Figures to the Dashboard
88 Adding Maps to the Dashboard
89 Adding Radio Buttons Above the Map
90 Interactivity Using Callbacks
91 Single Callback for Updating both World and USA Data
92 Callback to Change the Map
93 Dashboard Complete
94 Launching the Dashboard while Notebook Running
95 Opening dashboard.py
96 Comments in dashboard.py
97 Imports and Instantiation
98 Global Variables and Reading in the Data
99 Functions to Create Tables and Graphs
100 Creating the Navigation Bar
101 Creating the Dashboard Headers
102 Creating the Tabs and Tables
103 Creating the Graph Components
104 Creating the Map and Radio Buttons
105 Creating the Cards
106 Creating the Containers
107 Adding the Callbacks
108 Dashboard Complete
109 Opening the CSS File
110 CSS Variables
111 Top Info and Container CSS
112 Grid Container CSS
113 Grid Area CSS
114 Radio Button CSS
115 Tab CSS
116 Side Card CSS
117 CSS for Smaller Screens
118 Dash Summary
Deployment
119 What is a Web Server
120 Getting Started with Python Anywhere
121 The Python Anywhere Dashboard
122 Create New Web App
123 Upload the Files
124 Change the Working Directory
125 Modify WSGI File
126 Open Console
127 Install dash bootstrap components
128 Install statsmodels
129 Verify Dashboard is Up and Running
130 Create Daily Task to Run update.py
131 Log Files
132 Python Anywhere Deployment Complete
133 Deploying on Ubuntu with Vultr
134 Launch Ubuntu Server
135 Upgrade Instance to use IPv4
136 Install PuTTY (Windows)
137 SSH into Server (Windows)
138 SSH into Server (Mac and Linux)
139 Updating and Upgrading with apt
140 Install ZSH
141 Install pip and venv
142 Install NginX
143 Create Project Directory
144 Transfer project files to server (Windows)
145 Transfer project files to server (Mac and Linux)
146 Create Virtual Environment
147 Install Requirements
148 Configuring Gunicorn with systemd
149 Configure NginX to Communicate with Gunicorn
150 Accessing Log Files with journalctl
151 Automatic Daily Updates with a Cron Job
152 Deployment Complete
Resolve the captcha to access the links!